

What is the value of digital transformation to your operation? The answer lies in the multitude of benefits realized through increased situational awareness.
Situational awareness is defined as developing and maintaining a dynamic awareness of the situation and the risks present in an activity. This is based on gathering information from multiple sources from the task environment, understanding what the information means, and using it to think ahead about what may happen next.
The three aspects of information processing include perception, understanding/interpretation, and prediction.
Perception or gathering of information directly using our senses of vision, hearing, and touch, or indirectly through a complex control system involving HMI displays and interfaces.
Understanding information by combining this data from the production process or equipment with existing knowledge and experience from memory. Information gathered is given meaning. This includes developing an accurate and complete picture of the operation, better informing our decisions.
Prediction and projection into the future, which includes thinking ahead. This involves predicting what to expect as well as what not to expect.

-
- What happened? (perception)
- What is happening? (comprehension)
- What might happen in the near future? (projection or what to expect in the near future)
Situational awareness provides context to the complex data that your team receives from your production environment. It helps your team interpret data to make informed decisions that result in positive projected outcomes. Using post-failure analysis makes it possible to transition from a historical perspective of “running to failure” to a preventative and forward-looking system using real-time information from your process and equipment.
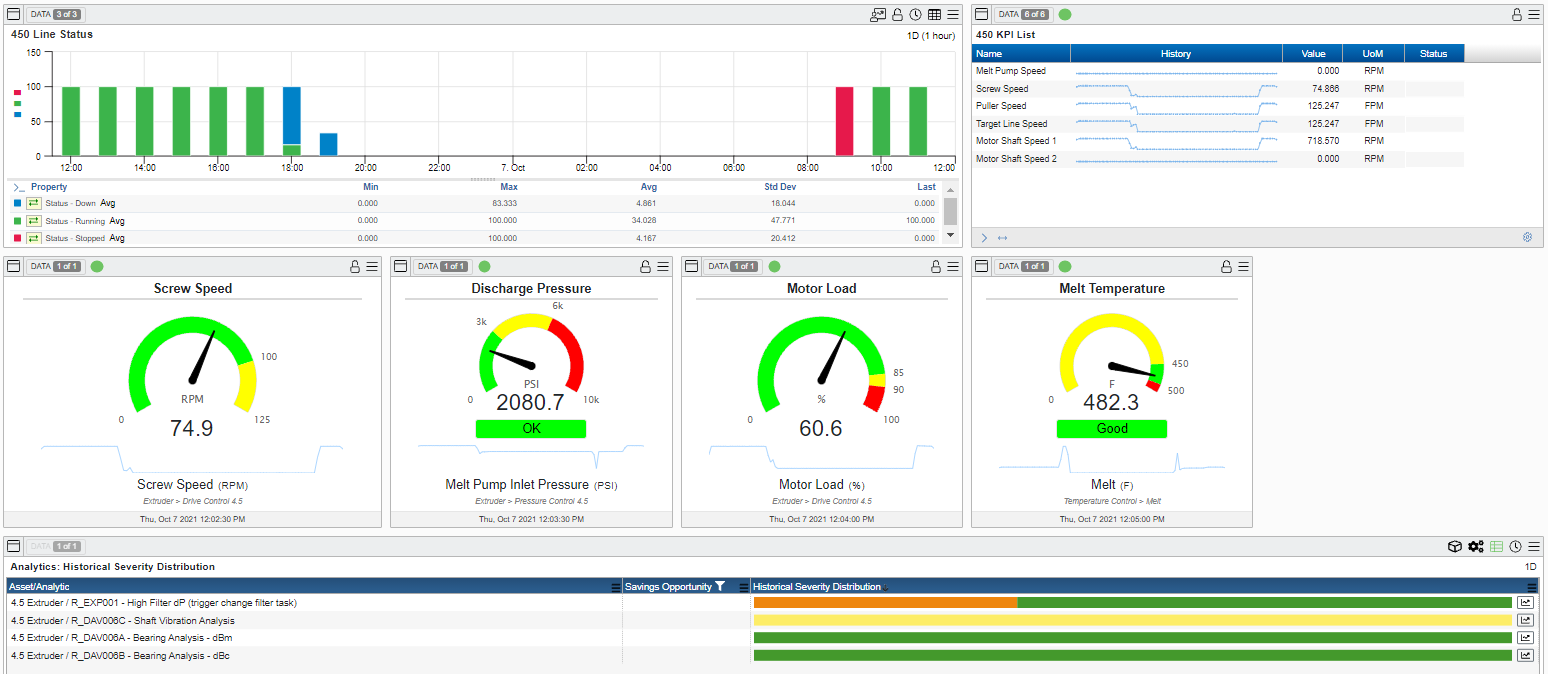
Perception –What has happened/is happening on my process and equipment?
DS Activ-Check™ uses visuals to summarize and present current process conditions and equipment performance. This enables your team of process technicians, maintenance, engineering, and management to understand the current state of the operation at-a-glance.
Team members do not have to download files or create graphs to gain insight. Instead, the information is presented logically in the form of informational dashboards. This allows for precious time to be spent resolving the issues and not hunting for them. In addition, users can gain access to their data anytime and anywhere via browser or mobile application. Accessibility can be tailored to each user, allowing system administrators to fully control the level of access and what data is visible to each user.
Here is an example of an extruder overview dashboard:
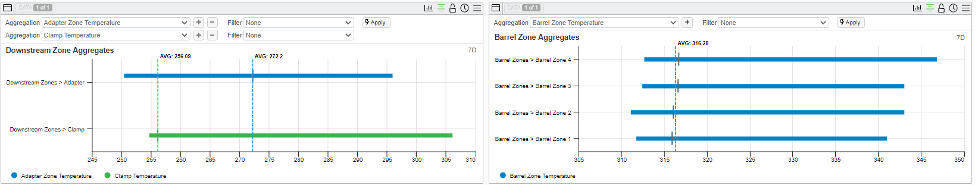
Comprehension – How is the system operating? Evaluation of the current quality parameters and trends.
Dashboards like the one above are designed to keep you aware of current line conditions and add context to data, so your team has a complete understanding of how system components interact and affect product quality.
An aggregate analytic continuously monitors important KPI during production runs and displays the degree of variation and overall average. It is a tool that visualizes variation of process and equipment performance. Again, system performance can be understood by just glancing at the dashboard.
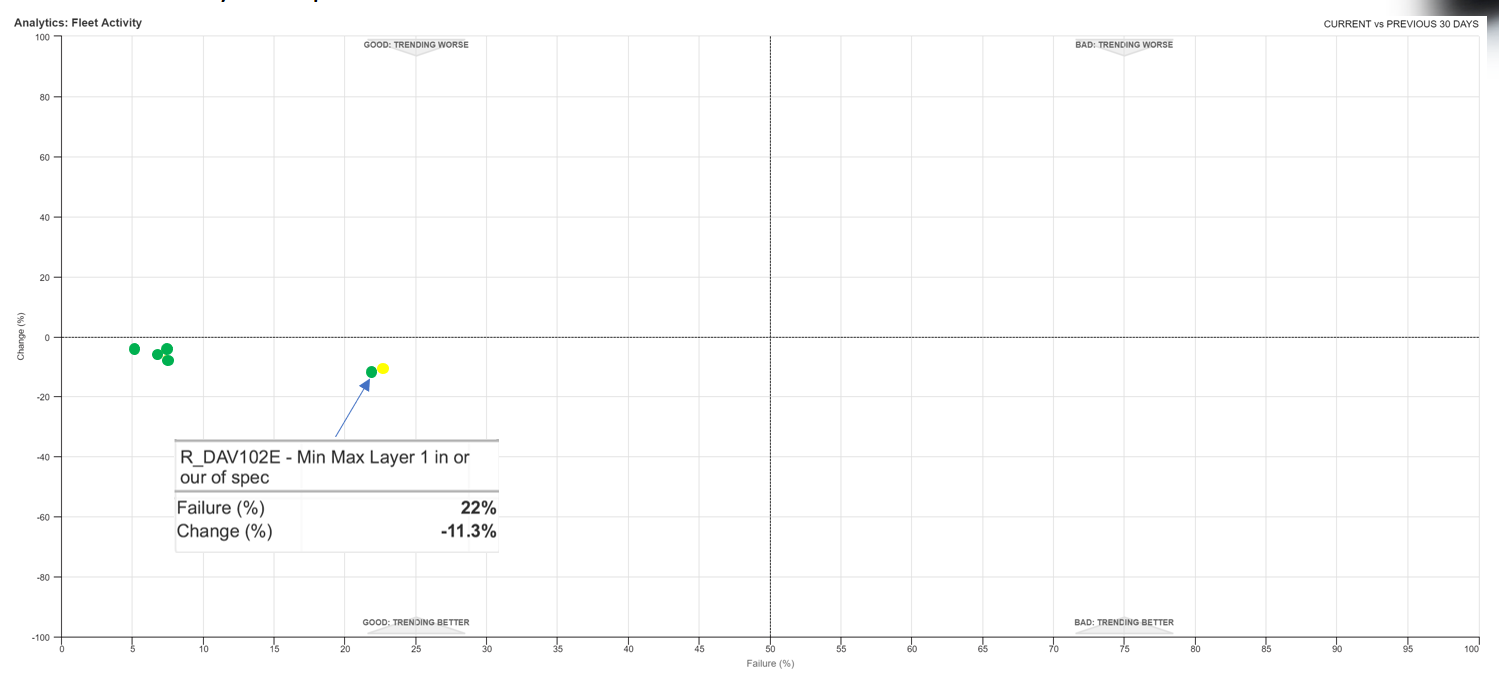
Projection – Helping your team use information effectively to predict future outcomes.
Trends of production system analytics are continuously monitored, tracked, and visually displayed using an activity map. This determines the direction of your process and equipment. Categories include: good trending better, good trending worse, bad trending better, and bad trending worse. Proactive steps can be taken to improve performance using this information. The team can clearly see how recent actions impact system performance in real-time.
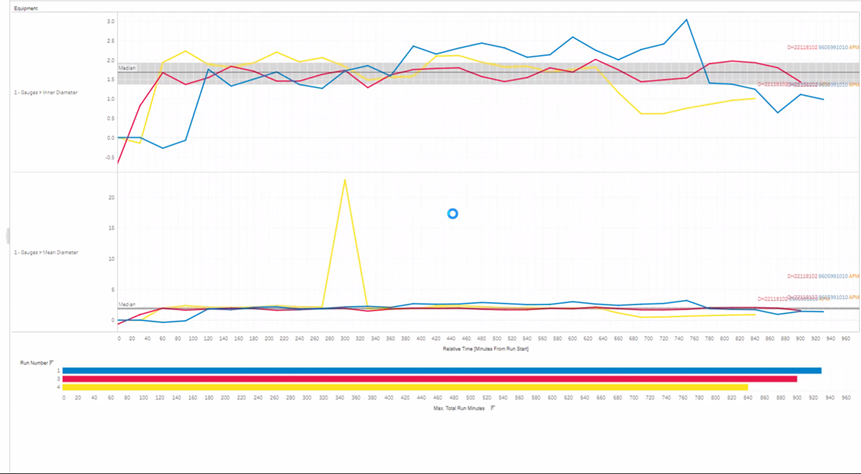
Taking this a step further, you can put your production data to work. An optimization toolbox uses production run information, including analytical performance parameters and KPIs, to select the best conditions for your process and equipment. This guides your team to select the most desirable line conditions to achieve the best performance for future production runs. The figure below shows a comparison of quality performance data from several production runs.
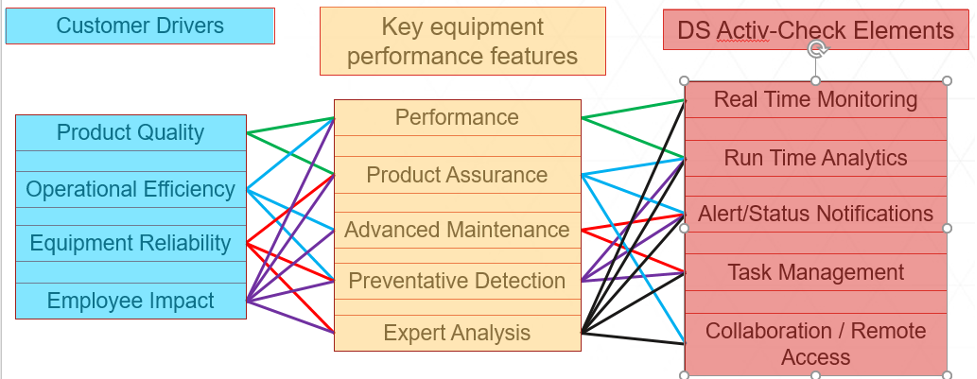
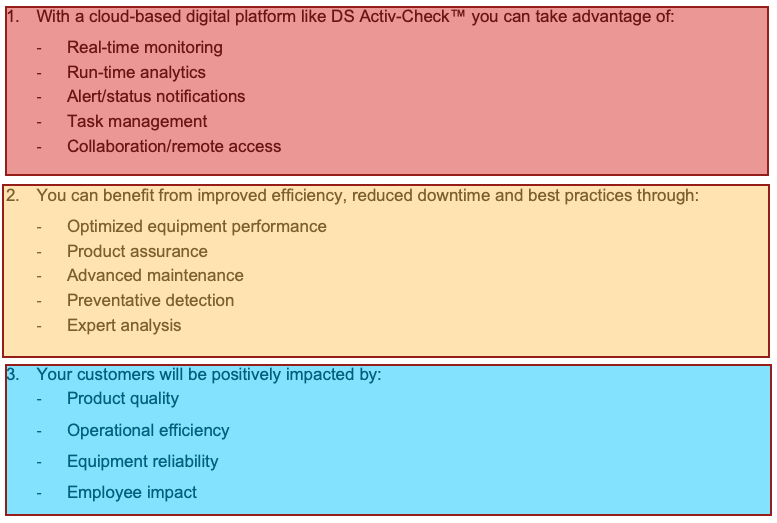
In summary, the advantages of digital transformation are threefold and interconnected.
By taking advantage of cloud-based platforms, you have a digital toolbox at your fingertips, enabling you to use the most up-to-date technology to enhance the performance of your extrusion line equipment. By improving situational awareness through technology such as the DS Activ-Check™, you will have greater control of operational variables that influence value, profitability, and better processing for you and your team. The possibilities are endless!
Have questions about this blog or the digital transformation series? Comment below!
Learn more about digital transformation and DS Activ-Check™ in the upcoming webinar – click the “Sign Me Up” button to register. And if you miss this webinar, you can still obtain the recording on-demand, just click below.

Want to inquire about the DS Activ-Check™ system? Contact us today.
Cheers,
The D-S Connect Blog Team